aah Diagnosis And Profiling
Introduced in v0.12.0. This document provides the insight into aah Diagnosis And Profiling feature and its usage.
Table of Contents
Configuration
Diagnosis configuration goes under config section runtime { ... }.
diagnosis {
    # Enable/Disable application diagnosis.
    #
    # Default value is `false`.
    enable = true

    # Profiling data collection mode. (Currently supports only HTTP mode
    # File mode is upcoming)
    #
    # Default value is `http`.
    mode = "http"

    # Customizing HTTP mode configuration.
    http {
        # HTTP address to expose profiling endpoints.
        #
        # Default value is `:7070`.
        address = "localhost:7000"

        # HTTP server timeout config.
        timeout {
            # Supported time units refer to https://golang.org/pkg/time/#ParseDuration
            #
            # Default value is `2m`.
            write = "3m"
        }
    }
}
Usage
Using above Diagnosis configuration aah user could easliy enable the profiling for aah application. Best way to enable diagnosis is to create an external config file and suppling it via startup args on command run.
<app-binary> run --envprofile prod --config /path/to/diagnosis.conf
Vist http://localhost:7070/diagnosis in your browser.
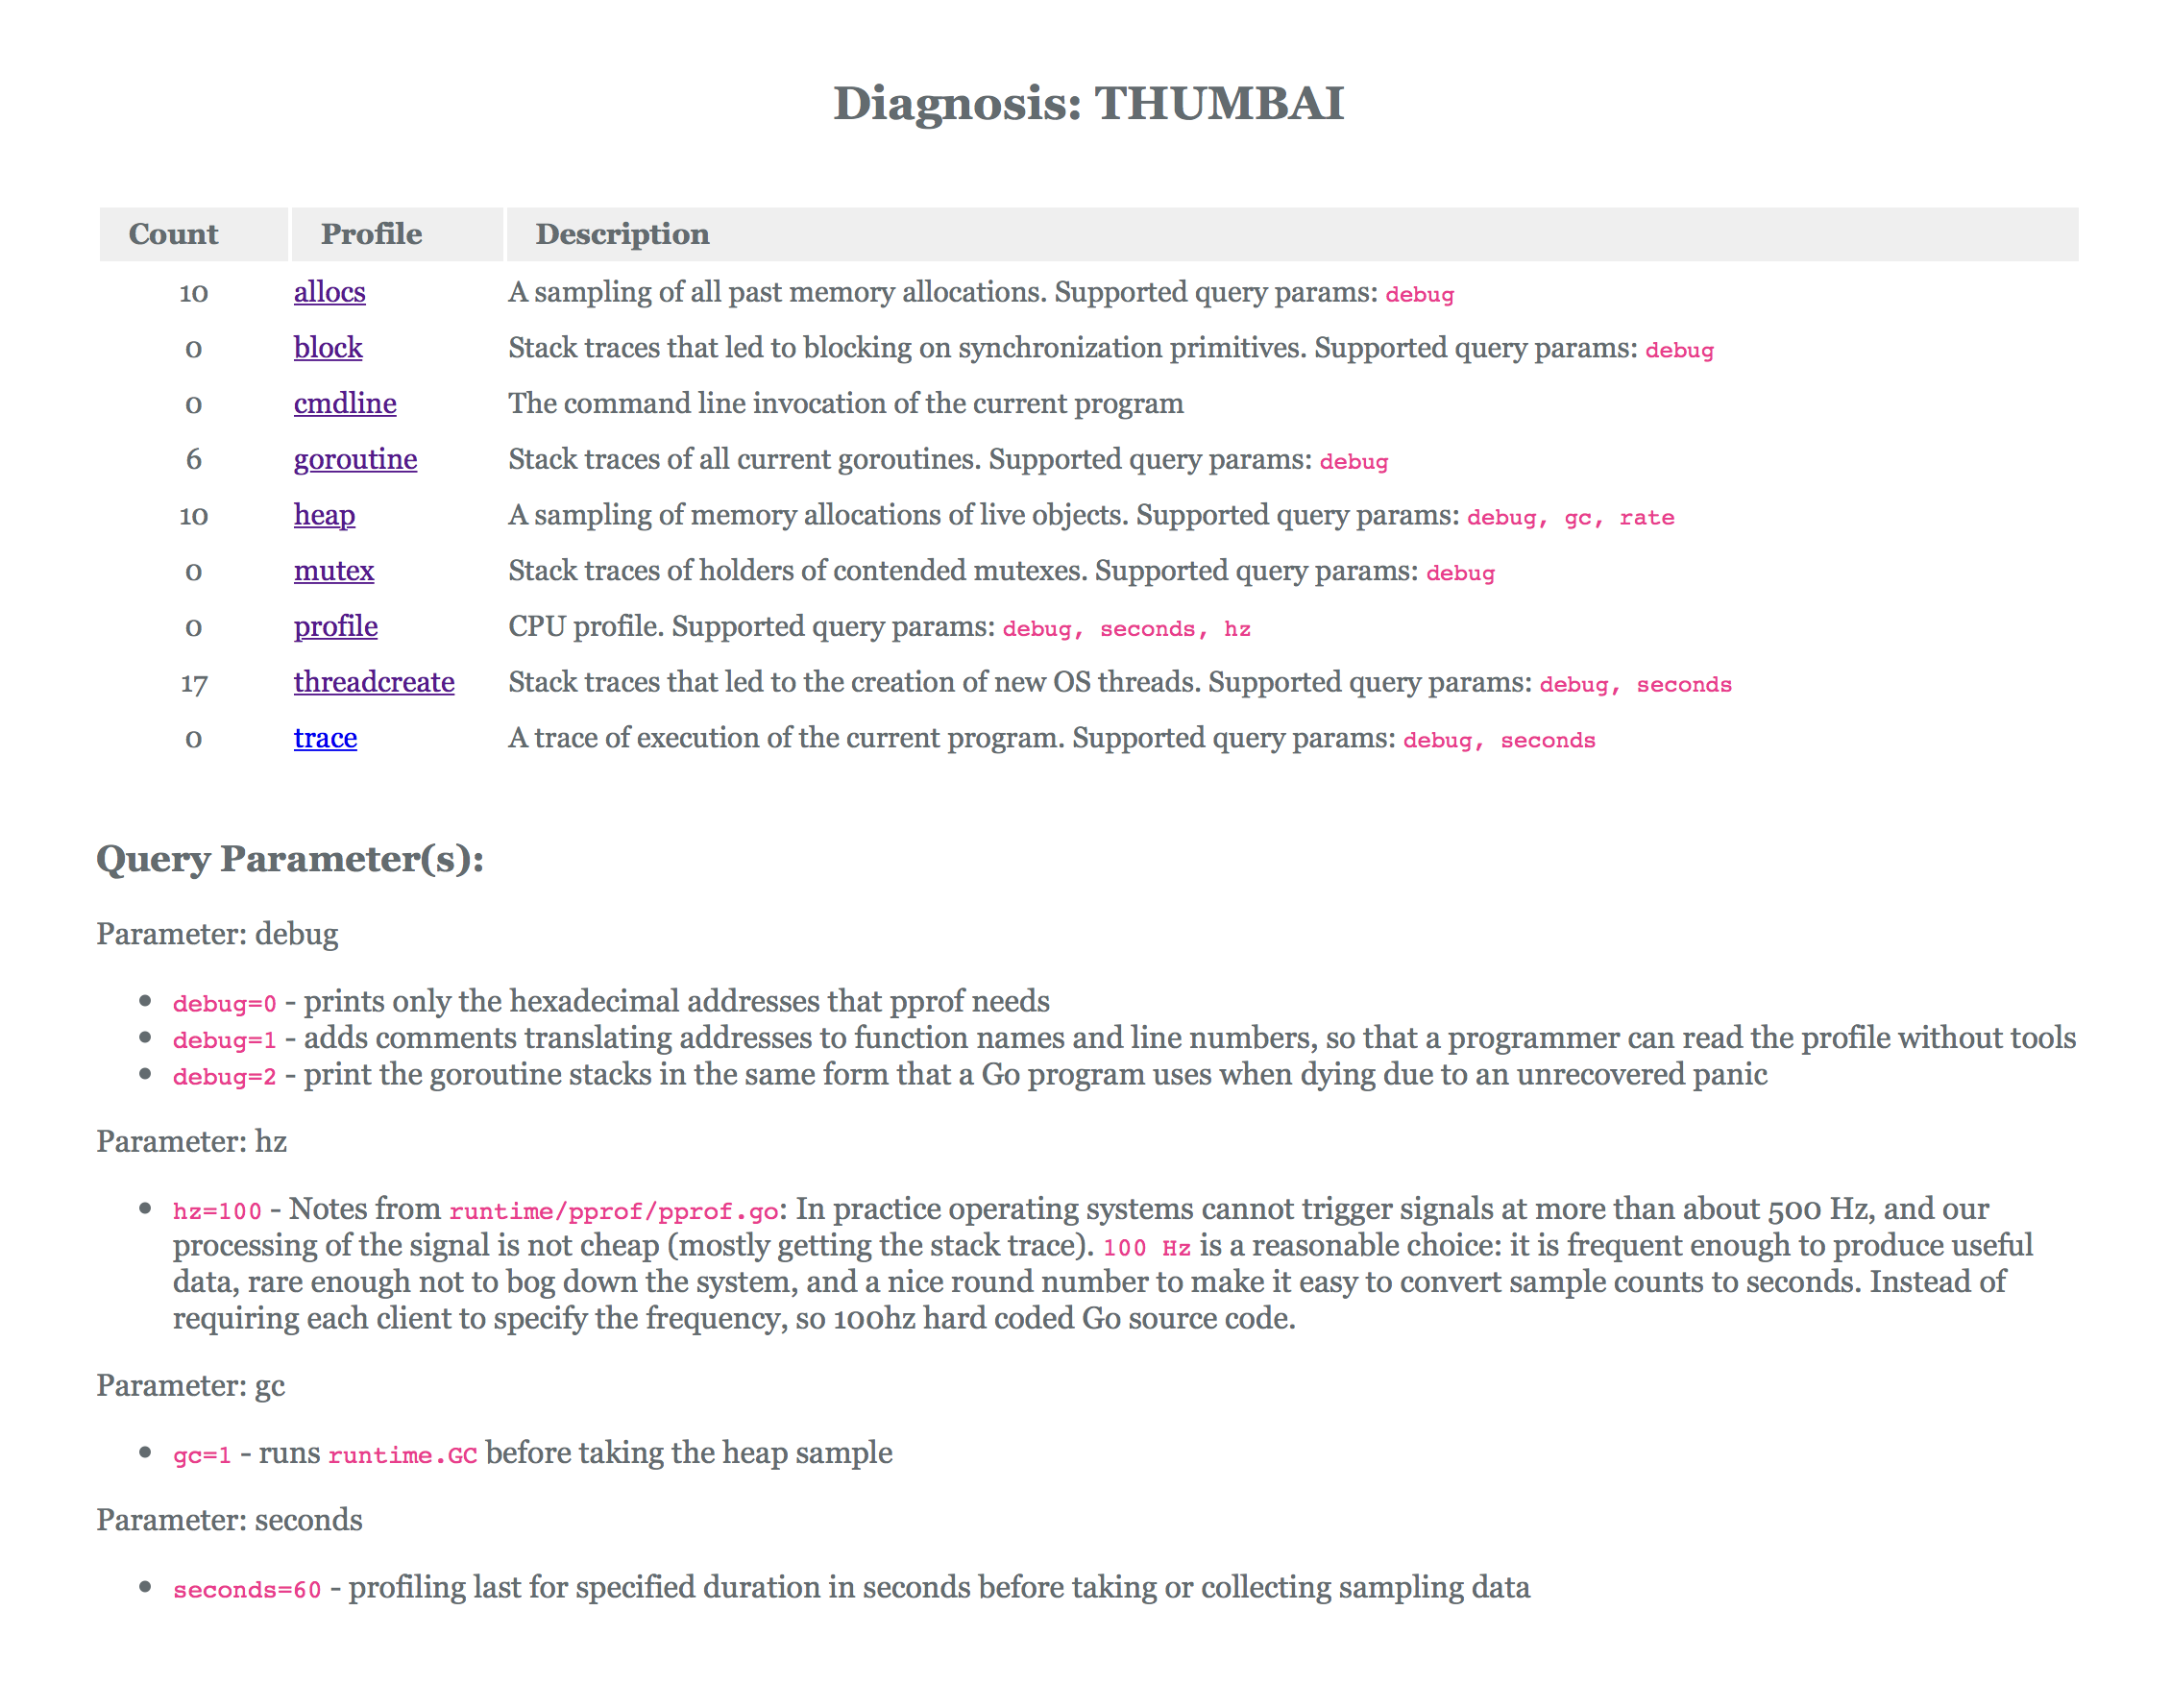
Profiling
Basically all profiling capabilities supported by packages runtime/pprof and runtime/trace. HTTP mode is same as package net/http/pprof capabilities and customized for easy to use with aah application.
Heap Profile
go tool pprof http://localhost:7070/diagnosis/pprof/heap?rate=8196
CPU Profile
go tool pprof http://localhost:7070/diagnosis/pprof/profile?seconds=60
Goroutine blocking profile
go tool pprof http://localhost:7070/diagnosis/pprof/block
Execution trace
wget http://localhost:7070/diagnosis/pprof/trace?seconds=5
The holders of contended mutexes
go tool pprof http://localhost:7070/diagnosis/pprof/mutex